Dubai Market Report, August 2026
Dubai registered 11,952 sales worth AED 27.16B in August 2026. Volume slipped 11.7% on the month and 5.0% on the year. The median sale was AED 1,205,000, or AED 1,701 per square foot, which rose 0.2% from last month. Off-plan took 74.9% of the month once developer sales filed as title deed are counted back in, up from a raw Oqood share of 68.8%. Resale was 24.9%. Buyers who borrowed did so at a median 80.0% of price. Priced per square foot, the market now sits 4.0% below its Q1 2026 high, so the read is a market off its peak rather than one turning.
Every figure below comes from official Dubai Land Department records for 1 to 31 August 2026.
Median prices: Apartments AED 1,066,420 · Villas & Townhouses AED 3,750,000 · Commercial AED 2,100,000 · Plots AED 4,170,870.
Where this sits in the cycle
A price is only meaningful next to the prices that came before it. Median price per square foot today, measured against the last cycle high, the 2020 low, and the most recent peak.
The long view, Dubai since 2008
Median price per square foot across the emirate, by quarter.
Monthly overview, last 13 months
| Month | Median AED/sq ft | MoM | QoQ | YoY |
|---|---|---|---|---|
| August 2026 | AED 1,701 | +0.2% | +3.7% | -1.0% |
| July 2026 | AED 1,697 | +0.5% | -8.0% | +2.4% |
| June 2026 | AED 1,689 | +3.0% | -2.3% | +2.5% |
| May 2026 | AED 1,640 | -11.1% | -6.7% | +2.2% |
| April 2026 | AED 1,845 | +6.7% | +1.4% | +15.8% |
| March 2026 | AED 1,729 | -1.6% | -4.8% | +8.1% |
| February 2026 | AED 1,757 | -3.4% | -0.4% | +13.2% |
| January 2026 | AED 1,820 | +0.2% | +7.6% | +18.0% |
| December 2025 | AED 1,817 | +2.9% | +6.9% | +14.5% |
| November 2025 | AED 1,765 | +4.4% | +2.8% | +16.7% |
| October 2025 | AED 1,691 | -0.5% | +2.0% | +6.3% |
| September 2025 | AED 1,700 | -1.0% | +3.2% | +10.4% |
| August 2025 | AED 1,718 | +3.7% | +7.1% | +15.2% |
Off-plan and resale
The raw Oqood share puts off-plan at 68.8% of the month. That undercounts it, because 732 developer-first sales were filed as title deed rather than Oqood. Counting those back gives an adjusted off-plan share of 74.9%, and the rest of the month is resale at 24.9%. Resale is up from 24.0% the month before.
| How the month splits | Sales | Share |
|---|---|---|
| Off-plan, adjusted | 8,954 | 74.9% |
| Resale | 2,972 | 24.9% |
| Other procedures | 26 | 0.2% |
| Total | 11,952 | 100.0% |
A title-deed sale is counted as developer-first when it is filed under a Development or Payment Plan procedure, or when it sits in a project not yet marked finished and is not land. Plots are excluded because a plot holds a real title deed even inside an unfinished masterplan. Other procedures are lease-to-own and similar registrations, which are neither an off-plan sale nor a resale.
Sales volume, last 25 months
Where the money went, price tiers
Share of the month's sales by price bracket, against last month.
Top areas of the month
| Area | Sales | Value | Median AED/sq ft |
|---|---|---|---|
| Dubai South | 1,971 | AED 2.61B | AED 1,716 |
| Wadi Al Safa 4 | 946 | AED 921.3M | AED 1,703 |
| Jabal Ali Industrial Second | 904 | AED 968.2M | AED 1,724 |
| Jumeirah Village Circle | 784 | AED 1.02B | AED 1,425 |
| Jebel Ali | 463 | AED 846.1M | AED 1,575 |
| Wadi Al Safa 5 | 462 | AED 1.02B | AED 1,437 |
| Wadi Al Safa 3 | 426 | AED 704.0M | AED 1,462 |
| Business Bay | 423 | AED 1.66B | AED 2,205 |
Which areas moved on price
Ranking areas by how many units sold tells you where the volume was. Ranking them by what a square foot costs tells you where the price moved. Of 47 areas with enough sales to measure in both months:
Biggest gains
| Area | Median AED/sq ft | MoM | Sales |
|---|---|---|---|
| Al Yufrah 1 | AED 1,930 | +30.0% | 311 |
| Al Hebiah Sixth | AED 1,720 | +15.5% | 57 |
| Dubai Investment Park First | AED 1,151 | +10.0% | 159 |
| Wadi Al Safa 2 | AED 1,379 | +9.8% | 60 |
| Wadi Al Safa 7 | AED 1,389 | +7.1% | 40 |
Biggest falls
| Area | Median AED/sq ft | MoM | Sales |
|---|---|---|---|
| International City | AED 761 | -21.1% | 172 |
| Dubai Marina | AED 2,273 | -9.7% | 258 |
| Al Barshaa South Third | AED 1,489 | -9.7% | 220 |
| Al Merkadh | AED 1,925 | -7.7% | 187 |
| Palm Jumeirah | AED 2,749 | -7.5% | 57 |
Areas with fewer than 30 cleaned sales in either month are excluded. A median built on a handful of deals moves on which units happened to sell, not on price.
Where the money is, prime and luxury
Dubai's totals are carried by a small number of large deals. Sales at AED 10M and above were just 2.5% of transactions but 26.5% of the money spent. Read the median for what a typical buyer paid, and this block for where the value sits.
What is still being built
Across the emirate, 375,705 units sit in 1,556 projects that are active, pending or not yet started. 224,981 of those have a planned completion date still ahead of them, starting with 29,992 units due in 2026.
The number worth watching is the one underneath that. 79,205 units are already past the date recorded against them and still not finished. That is late supply, not lost supply: 35,229 of those units are in projects already at least half built. It will arrive, and when it does it competes with everything standing today, which is why a pipeline read only off future dates understates what is coming.
| Planned handover | Projects | Units |
|---|---|---|
| 2026 | 140 | 29,992 |
| 2027 | 395 | 83,694 |
| 2028 | 277 | 68,752 |
| 2029 | 103 | 32,390 |
| 2030 | 12 | 9,579 |
| 2031 | 2 | 574 |
| Past their planned date | 363 | 79,205 |
| Cancelled | 16 | 6,842 |
| No date on file | 248 | 64,677 |
| Total under way | 1,556 | 375,705 |
Counts from the DLD project register, not a forecast. Dates are the planned end date recorded against each project, not a construction estimate. Announced dates move, and this reports what is on file today.
The month's highest sale
Best-selling projects
Ranked on resale only. Developers register off-plan sales in batches, so an off-plan ranking would show which developer filed paperwork this month rather than which project buyers actually chose.
| Project | Resales | Median price |
|---|---|---|
| The Greens at Sobha Sanctuary | 79 | AED 4,170,870 |
| The Brooks at Sobha Sanctuary | 57 | AED 5,690,155 |
| LIV WATERSIDE | 48 | AED 2,544,548 |
| Binghatti Apex | 36 | AED 1,150,000 |
| Luma Park Views | 28 | AED 1,247,232 |
Most active developers, last 12 months
Ranked by recorded sales. This measures activity, not quality. Figures in brackets are transaction counts.
| Developer | Sales | Share | Busiest projects |
|---|---|---|---|
| Azizi Developments | 13,864 | 12.7% | AZIZI VENICE 14 (1934), Azizi Venice 6 (939), Azizi Venice 15 (772) |
| Binghatti Developers | 9,742 | 9.0% | Binghatti Vintage (1054), Binghatti Hillviews (710), Binghatti Aquarise (579) |
| Sobha | 4,067 | 3.7% | Skyvue (592), Sobha Central Phase II (517), Sobha Solis (497) |
| Emaar Development | 2,791 | 2.6% | The Valley - Vindera (392), The St. Regis Residences, Downtown Dubai (98), Grand Polo - Selvara 4 (91) |
| Danube Properties Development | 2,606 | 2.4% | Breez by Danube (635), Timez By Danube (359), ASPIRZ By Danube (357) |
The rental market
Over the three months to Aug month-end, 158,892 residential Ejari contracts were registered across Dubai. 46% were new leases and 54% renewals. Median annual rents came in at AED 67,200 for apartments and AED 177,450 for villas and townhouses.
Median annual rent over median sale price, city-wide, residential only. It indicates what the market yields, not what any single property returns, because the rent sample and the sale sample are different units.
Over the last 13 months, apartment sales went from 10,594 to 9,914 a month (-6%), and villas and townhouses from 678 to 846 (+25%).
Mortgages
3,492 mortgages were registered in August 2026 (▼ -13.5% MoM), at a median of AED 1,450,000. Of those, 3,146 were new registrations, 141 modifications and 23 portfolio loans.
Across the 1,507 purchase mortgages we can match to their own sale, the median loan was 80.0% of the price paid, with the middle half falling between 70.0% and 80.0%. That is the regulatory ceiling for a first home, so most buyers who borrow are borrowing as much as the rules allow.
Matched purchases are 43.2% of the month's mortgage registrations. Refinancing and portfolio lending have no matching sale and are not included.
City-wide medians are a starting point, not a valuation. What matters to an owner is what sold in their own building this month.
- Send us your building name and we will reply with what actually sold there last month, unit sizes and prices included.
- Ask for a valuation range on your own unit, based on comparable sales rather than an asking-price average.
- Prefer it monthly? Subscribe and this report lands the day it publishes.
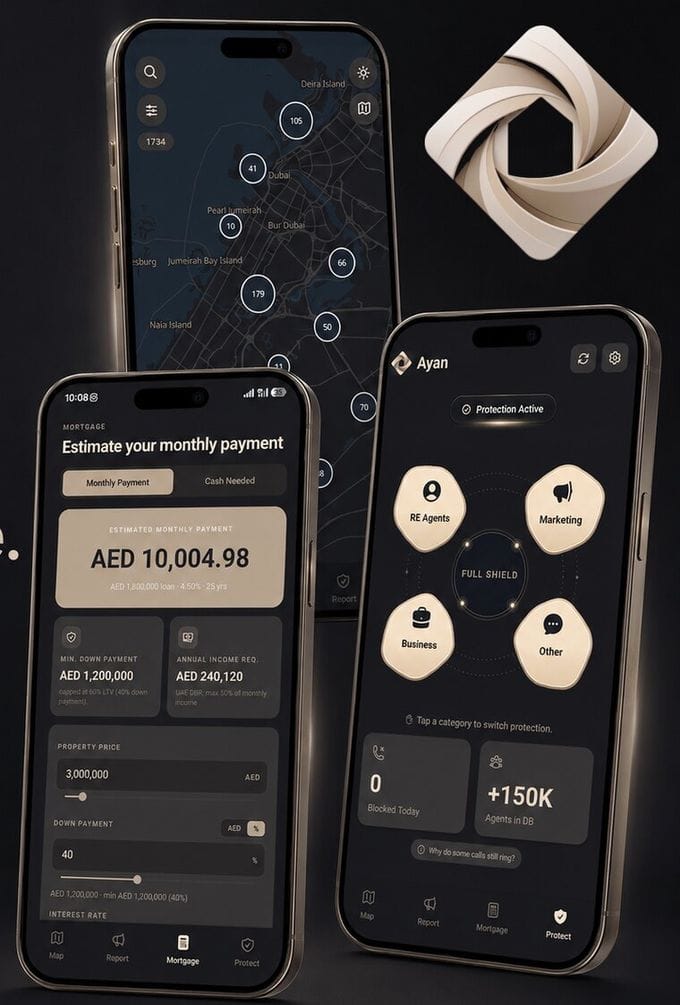
A live off-plan map of 1,700+ UAE projects, a full UAE mortgage calculator and OS-level spam-call protection, all in one app.
Get the AYAN app →Or go straight to the App Store or Google Play. On a computer? Open map.YAZDAN in your browser, no download needed.
YAZDAN Properties reads the DLD numbers for your goal, whether you're buying, selling or investing, and tells you plainly what they mean for you.
Book a 30-minute advisory call → WhatsApp usOr email info@yazdan.ae directly.