By YAZDAN Properties Research · Last updated 19 May 2026
30-Second Read — Is this for you?
In one line. Dubai's property market just had its biggest quarter ever — AED 252 billion in transactions across 45,000+ deals. This article unpacks what the record means and what it does not.
Best for. International investors weighing Dubai entry, current owners deciding whether to hold or sell, and anyone tired of generic market hype.
What you will learn.
- How Q1 2026 compares to prior quarters on volume, off-plan share, and foreign buyer activity
- Where the AED 252 billion is concentrated by area and buyer origin
- Whether this pace is sustainable — and what would change it
Bottom line. Dubai is no longer a cyclical story; it is becoming structural. The relevant question is no longer "is it too late?" but "which segment fits my position?".
Dubai Quarterly Transaction Volume
| Quarter | Transactions | Total Value (AED) | YoY Change |
|---|---|---|---|
| Q1 2024 | ~30,000 | ~140 billion | baseline |
| Q1 2025 | ~38,000 | ~190 billion | +36% |
| Q1 2026 | ~45,000 | 252 billion | +33% |
| Trend | Up | Up | Compounding |
Key Facts at a Glance
- AED 252 billion total real-estate transactions in Q1 2026, a quarterly record (DLD)
- 45,000+ transactions logged in Q1 2026 vs ~38,000 in Q1 2025 (DLD, quarter-on-quarter)
- Off-plan share of transaction volume above 60% in Q1 2026, the highest since 2008
- Foreign buyer share concentrated in JVC, Dubai South, Business Bay, MBR City (Bayut Q1)
- Average ticket size higher in luxury (Palm, Emirates Hills) than mass-market areas
Introduction
This article works through the headline figure, what sits underneath it, and what it implies for anyone holding or considering a position in this market. The Key Facts box above lists the core data points so you can scan them in seconds; the three sections below explain what they actually mean.
What the AED 252 Billion Figure Represents
Dubai recorded AED 252 billion in real-estate transactions in Q1 2026 — a quarterly record on roughly 45,000 deals.
The figure represents the total transaction value logged with the Dubai Land Department for the quarter, covering off-plan and resale, apartments and villas, cash and mortgaged purchases. The Q1 2025 comparable was around AED 190 billion across 38,000 deals. That is a 33 percent rise in value and an 18 percent rise in volume year on year — the volume figure being the more telling one, because volume is harder to inflate through high-value outliers than total transaction value is.
Where the Capital is Concentrated
Most of the Q1 volume sits in a handful of areas, not spread evenly across Dubai.
Foreign buyer demand concentrates in JVC, Dubai South, MBR City, Business Bay, and Dubai Marina for apartments. For villas, Damac Hills 2, Tilal Al Ghaf, and The Valley dominate the secondary market. Luxury volume runs through Palm Jumeirah, Emirates Hills, and District One. The geographic concentration matters because it shows where international capital actually moves — which is not always the areas that get the most coverage. The areas that absorb most foreign demand tend to have transparent transaction data, established resale markets, and predictable service-charge regimes.
What the Off-Plan Share Tells Us
A figure that large changes how the headline should be read. Off-plan transactions sit in escrow with multi-year payment plans; they behave differently from completed sales in both upside scenarios and stress scenarios. The buyer commitment is real, but the cash deployment is staged. For a market reading, this means the AED 252 billion figure overstates the immediate liquidity event by a wide margin. The genuine signal is the sustained off-plan absorption rate — and it has now run high for five consecutive quarters, which is the part worth tracking.
"Q1 transaction value can be inflated by a handful of luxury deals; transaction count cannot. The 45,000-plus deals logged in Q1 2026 is the figure worth tracking, not the headline AED total."
— YAZDAN Research
 Noor Al Nahyan
Frequently Asked Questions
What drove Dubai's AED 252 billion Q1 2026 figure?
A combination of strong off-plan launches from Emaar, Damac, Sobha and continued foreign buyer demand from the UK, Russia, India, and China. Off-plan transactions alone accounted for the majority of volume.
Is the Q1 2026 record sustainable through the year?
It is too early to call. Most analysts assume Q2 normalises slightly but full-year 2026 still beats 2025 unless a major external shock occurs. Watch the Q2 DLD release in early July 2026.
Does record transaction volume mean prices keep rising?
Not automatically. Volume measures activity, not price direction. Some segments (mass-market apartments) saw price softening even as volume rose. Look at price-per-square-foot data alongside volume.
How does Dubai Q1 2026 compare to other global markets?
Dubai's transaction velocity is among the highest of any major global real estate market. London and Singapore saw declines in Q1 2026 while Dubai grew double digits.
Where is the foreign capital concentrated?
JVC, Dubai South, MBR City, Business Bay, and Dubai Marina absorb the bulk of international buyer demand for apartments. For villas, Damac Hills 2, Tilal Al Ghaf, and The Valley dominate.
Is now still a good time to enter the Dubai market?
Entry timing depends on holding period and yield target, not on whether the market is up or down. Areas with 7%+ gross yield (Arjan, JVC, Dubai South) preserve cashflow even if prices plateau.
Conclusion
The most useful habit when reading data like this is to date the figures and re-check them at the next release. The picture that emerges from a sequence is consistently more reliable than the one any single release suggests, particularly in a market where headline numbers can be moved by a small number of large transactions.
Want a tailored read for your own position?
YAZDAN Properties is a Dubai-based real-estate advisory firm. We work with international and UAE-based investors on neutral, data-led reviews — no pressure, no commission talk, just a clear look at the numbers.
Reach the team at info@yazdan.ae.
This article is editorial analysis and does not constitute investment advice. All figures cited are sourced and dated; market data may have moved since publication.
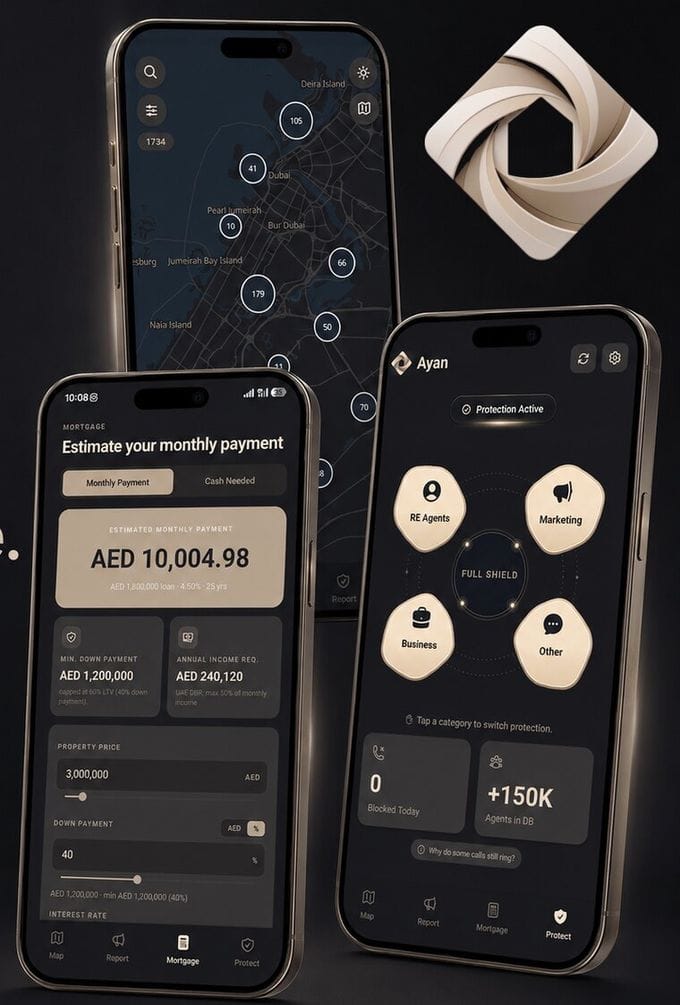
A live off-plan map of 1,700+ UAE projects, a full UAE mortgage calculator and OS-level spam-call protection, all in one app.
Get the AYAN app →Or go straight to the App Store or Google Play. On a computer? Open map.YAZDAN in your browser, no download needed.
YAZDAN Properties reads the DLD numbers for your goal, whether you're buying, selling or investing, and tells you plainly what they mean for you.
Book a 30-minute advisory call → WhatsApp usOr email info@yazdan.ae directly.