Community report · September 2026 · Dubai Land Department data to 28 October 2026
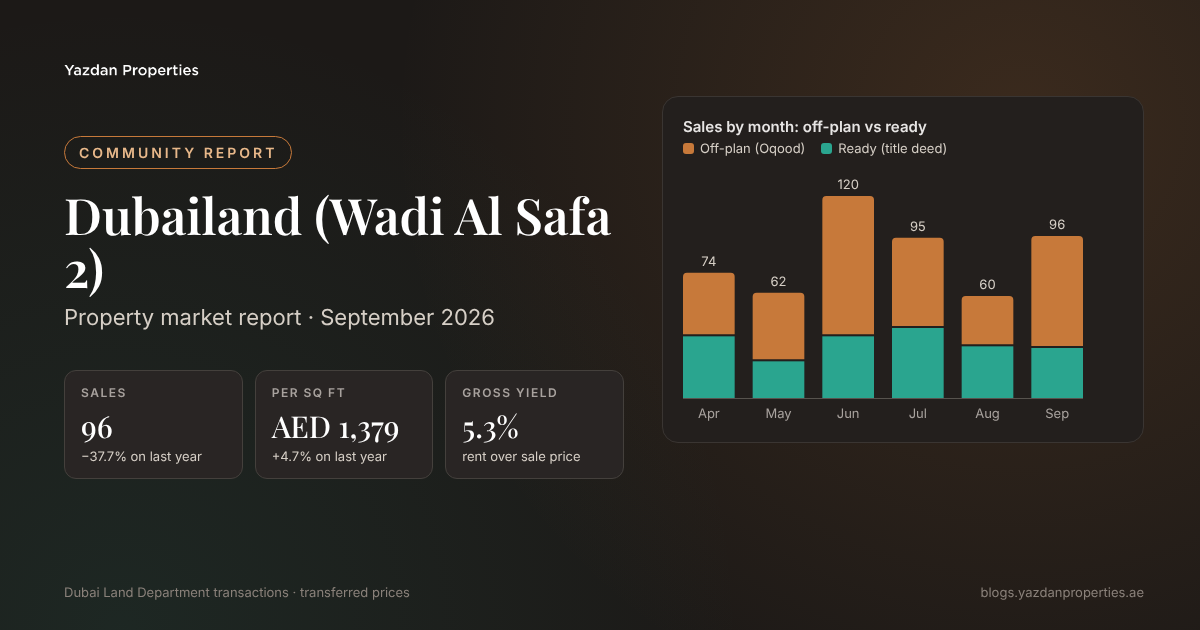
Dubailand (Wadi Al Safa 2) recorded 96 sales worth AED 118.91M in September 2026, down 37.7% on Sep 2025. The median sale was AED 977,388 at AED 1,379 per sq ft, and off-plan took 68.8% of the month. Every figure comes from Dubai Land Department records.
▼ −37.7% YoY
▼ −14.5% YoY
▲ +4.7% YoY
Dubai Land Department records this part of Dubailand as the district Wadi Al Safa 2. The figures cover that whole district.
Off-plan vs ready: the last six months
Off-plan sales are Oqood registrations: homes bought from the developer before handover. Ready sales are homes that already have a title deed, mostly resales. "Other" covers gifts, grants and similar transfers.
| Month | Off-plan (Oqood) | Ready (title deed) | Other | Total | Off-plan share |
|---|---|---|---|---|---|
| Apr 2026 | 37 | 37 | 3 | 77 | 48.1% |
| May 2026 | 40 | 22 | 1 | 63 | 63.5% |
| Jun 2026 | 83 | 37 | 1 | 121 | 68.6% |
| Jul 2026 | 53 | 42 | 1 | 96 | 55.2% |
| Aug 2026 | 29 | 31 | 0 | 60 | 48.3% |
| Sep 2026 | 66 | 30 | 0 | 96 | 68.8% |
| Six months | 308 | 199 | 6 | 513 | 60% |
Source: DLD-registered sales by calendar month, Apr 2026 to Sep 2026, cleaned of share transfers and data errors.
By property type
The same split by property type, over the six months to 28 October 2026.
| Type | Sales | Off-plan | Ready | Off-plan share | Median price | Median per sq ft |
|---|---|---|---|---|---|---|
| Apartments | 421 | 260 | 161 | 61.8% | AED 940,000 | AED 1,345 |
| Villas and townhouses | 45 | 33 | 12 | 73.3% | AED 1,320,000 | AED 1,224 |
Source: DLD-registered sales, the six months to 28 October 2026. "Villas and townhouses" is one DLD category. Medians shown only where there are 30+ sales.
Price per sq ft over time
The median price per sq ft in September 2026 compared with earlier months. A change is shown only when both months have at least 30 sales.
| Compared with | Month | Then | Sales then | Change to Sep 2026 |
|---|---|---|---|---|
| 1 month | Aug 2026 | AED 1,379 | 60 | +0% |
| 3 months | Jun 2026 | AED 1,409 | 121 | −2.1% |
| 6 months | Mar 2026 | AED 1,284 | 90 | +7.4% |
| 12 months | Sep 2025 | AED 1,317 | 154 | +4.7% |
Monthly medians swing with the mix of homes sold. The quarterly series is steadier:
| Quarter | Median per sq ft | Sales | Change on quarter |
|---|---|---|---|
| Q3 2025 | AED 1,468 | 527 | |
| Q4 2025 | AED 1,466 | 459 | −0.1% |
| Q1 2026 | AED 1,287 | 308 | −12.2% |
| Q2 2026 | AED 1,346 | 261 | +4.6% |
| Q3 2026 | AED 1,343 | 252 | −0.2% |
Source: DLD-registered sales. Quarters with fewer than 10 sales are left out. Sep 2026 median: AED 1,379 per sq ft from 96 sales.
Rents and yield
1,454 Ejari rent contracts were registered in the three months to the end of September 2026: 896 new leases and 558 renewals. The median annual rent was AED 52,000. Set against the median sale price, that is a gross yield of 5.3%.
A note on that yield: most sales here are off-plan, so the price side is mostly launch prices for homes that are not built yet, while the rent side is today's rents on finished homes. Buying a ready home on resale usually gives a lower yield. Ask us for the figure on a specific building.
| Type | Median annual rent | Contracts |
|---|---|---|
| Apartments | AED 52,000 | 7,881 |
| Villas and townhouses | AED 200,000 | 511 |
Source: DLD Ejari contracts, 24 months to 28 October 2026. Gross yield is before service charges, fees and empty months.
What sold in September 2026
| Layout | Sales | Share |
|---|---|---|
| 1-bed | 53 | 55.2% |
| Studio | 22 | 22.9% |
| 2-bed | 16 | 16.7% |
| 4-bed | 2 | 2.1% |
| Other / not stated | 2 | 2.1% |
| 3-bed | 1 | 1% |
By price band, compared with the month before:
| Price band | Sep 2026 | Aug 2026 |
|---|---|---|
| AED <500K | 4.2% | 5% |
| AED 500-750K | 21.9% | 16.7% |
| AED 750K-1M | 24% | 20% |
| AED 1-1.5M | 37.5% | 31.7% |
| AED 1.5-2M | 8.3% | 6.7% |
| AED 2-3M | 2.1% | 6.7% |
| AED 3-5M | 0% | 1.7% |
| AED 5-10M | 1% | 6.7% |
| AED 10M+ | 1% | 5% |
Best-selling projects in September 2026
| Project | Sales | Median price |
|---|---|---|
| Sakura Gardens by HRE | 40 | AED 1,262,930 |
| Empire Lakeviews | 7 | AED 1,024,777 |
| Parkgreen Residences by Alishaan | 5 | AED 860,000 |
| Zenith One | 5 | AED 500,000 |
| Bianca | 5 | AED 1,320,000 |
Projects with at least 3 sales in the month. Includes off-plan and ready sales.
Most active developers, last 24 months
| Developer (DLD registered name) | Sales | Share | Main projects |
|---|---|---|---|
| Ellington Karma Developers | 490 | 21.8% | Belgravia Gardens |
| Empire Crown Real Estate Development | 403 | 18% | Empire Lakeviews |
| Al Mazaya Real Estate | 338 | 15.1% | Qpoint Liwan-Plot R008 A&B, Qpoint Liwan-Plot R005, Qpoint Liwan - Plot R002 |
| Clear Vision Real Estate Development | 294 | 13.1% | Reem by vision, Celine By Vision, Karma |
| Hre Real Estate Development | 186 | 8.3% | Sakura Gardens by HRE, Sakura Gardens by HRE |
What the numbers say
- The median price per sq ft is 4.7% higher than in Sep 2025 (AED 1,379 against AED 1,317). Monthly medians move with the mix of homes sold, so check the quarterly line before reading too much into one month.
- Off-plan dominates: 60% of sales over the past six months were Oqood registrations, so prices here mostly reflect developer launch pricing, not resale values.
- Gross yield on DLD figures is 5.3%, but most sales here are off-plan, so that compares today's rents with launch prices for homes not yet built. A ready home bought at today's resale price will usually yield less.
- The best-selling project in September 2026 was Sakura Gardens by HRE with 40 sales.
Common questions
What is the average price per sq ft in Dubailand (Wadi Al Safa 2)?
The median sale in Dubailand (Wadi Al Safa 2) in September 2026 was AED 1,379 per sq ft across 96 DLD-recorded sales, 4.7% higher than a year earlier.
Is Dubailand (Wadi Al Safa 2) mostly off-plan or ready?
Over the six months to September 2026, 60% of Dubailand (Wadi Al Safa 2) sales were off-plan (Oqood) and the rest were ready homes with title deeds.
What is the rental yield in Dubailand (Wadi Al Safa 2)?
Gross yield on DLD figures was 5.3% in September 2026: the median annual rent of AED 52,000 over the median sale price. Most sales are off-plan, so a ready home bought on resale will usually yield less.
Off-plan projects selling in Dubailand (Wadi Al Safa 2)
Developer prices, payment plans and handover dates for projects launching or selling now:
- Lumina by Vision by Vision Developments, from AED 553K, handover Q4 2028
- Dubailand (Wadi Al Safa 2) area guide: prices, rents and yields
- Dubailand (Wadi Al Safa 2) rental yield, by home size
- Dubai market report, September 2026
- Dubai property rankings, September 2026: yields, prices and rents by area
- Dubai off-plan projects: prices and payment plans
- Off-plan projects on one live map
Thinking about Dubailand (Wadi Al Safa 2)?
We'll pull the DLD numbers for the exact building and unit you're looking at: recent sales, rents and service charges, before you commit.
Book a 30-minute advisory call →Prefer WhatsApp? Chat with us on WhatsApp
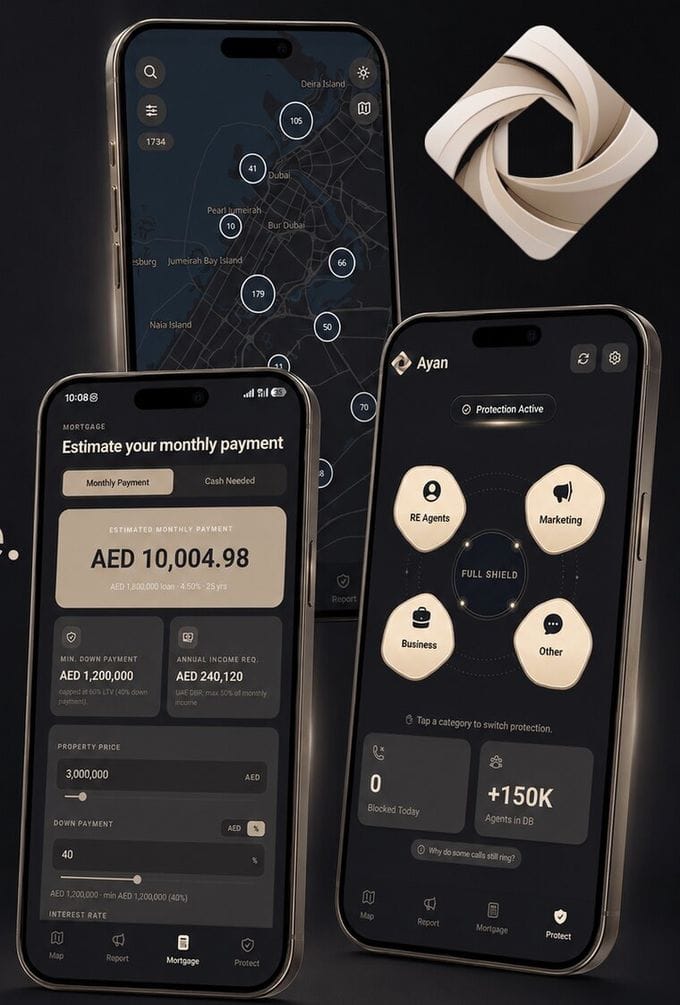
A live off-plan map of 1,700+ UAE projects, a full UAE mortgage calculator and OS-level spam-call protection, all in one app.
Get the AYAN app →Or go straight to the App Store or Google Play. On a computer? Open map.YAZDAN in your browser, no download needed.