Dubai property rankings for September 2026, built from Dubai Land Department sales and Ejari rent contracts: rental yields, prices per sq ft, rents, year-on-year price changes, off-plan share and the most sold projects. Updated every month.
Highest rental yields
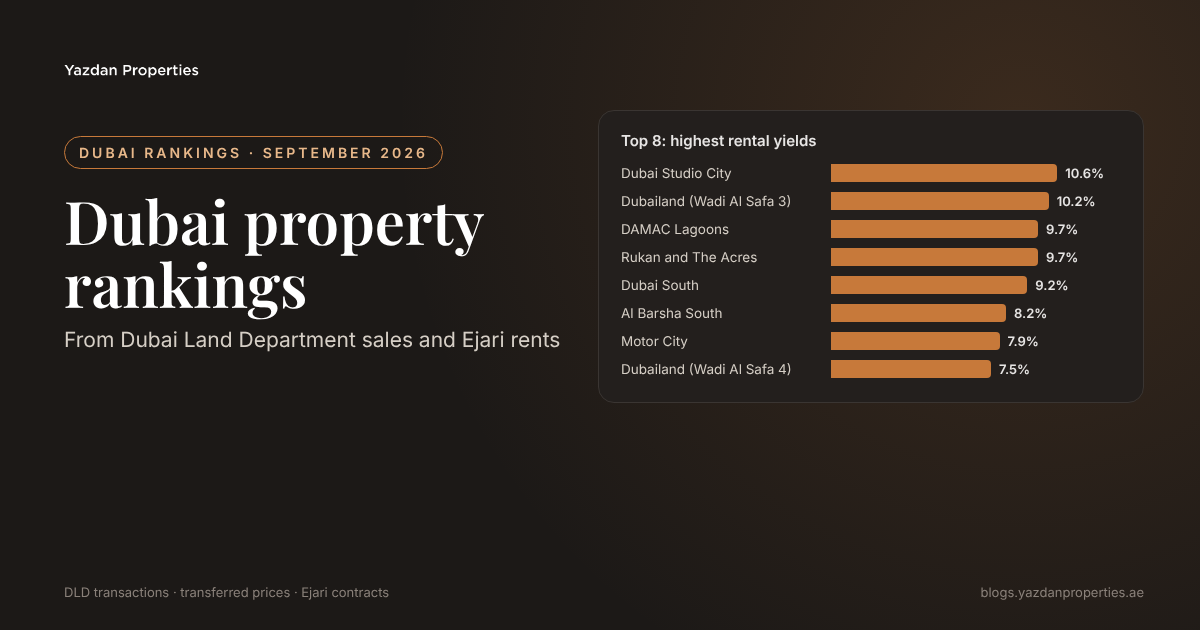
Dubai Studio City had the highest gross rental yield in Dubai in September 2026, at 10.6%, followed by Dubailand (Wadi Al Safa 3) (10.2%) and DAMAC Lagoons (9.7%). The table ranks 45 areas by gross yield: the median Ejari rent over the past three months divided by the median DLD sale price.
| # | Area | Gross yield |
|---|---|---|
| 1 | Dubai Studio City * | 10.6% |
| 2 | Dubailand (Wadi Al Safa 3) * | 10.2% |
| 3 | DAMAC Lagoons * | 9.7% |
| 4 | Rukan and The Acres | 9.7% |
| 5 | Dubai South * | 9.2% |
Cheapest areas to buy
International City was the cheapest Dubai area to buy in September 2026, at a median of AED 900 per sq ft, then DAMAC Hills 2 (AED 1,022) and Dubai Investments Park 1 (AED 1,036). The table ranks 46 areas with at least 30 recorded sales by median price per sq ft.
| # | Area | Median per sq ft |
|---|---|---|
| 1 | International City | AED 900 |
| 2 | DAMAC Hills 2 | AED 1,022 |
| 3 | Dubai Investments Park 1 | AED 1,036 |
| 4 | Dubai Silicon Oasis | AED 1,117 |
| 5 | Warsan 4 | AED 1,194 |
Most expensive areas
Dubai Maritime City was Dubai's most expensive area in September 2026, at a median of AED 3,202 per sq ft, ahead of Zabeel and Dubai Design District (AED 3,124) and City Walk (AED 3,062).
| # | Area | Median per sq ft |
|---|---|---|
| 1 | Dubai Maritime City | AED 3,202 |
| 2 | Zabeel and Dubai Design District | AED 3,124 |
| 3 | City Walk | AED 3,062 |
| 4 | Palm Jumeirah | AED 2,960 |
| 5 | Downtown Dubai | AED 2,842 |
Cheapest areas to rent
International City had the lowest median rent of the areas we track in September 2026, at AED 40,000 a year, followed by Dubai Investments Park 1 (AED 45,800) and Warsan 4 (AED 48,000). Figures are medians of Ejari contracts registered over the three months to the end of September 2026.
| # | Area | Median rent a year |
|---|---|---|
| 1 | International City | AED 40,000 |
| 2 | Dubai Investments Park 1 | AED 45,800 |
| 3 | Warsan 4 | AED 48,000 |
| 4 | Dubailand (Wadi Al Safa 2) | AED 52,000 |
| 5 | Dubai Production City | AED 54,000 |
Biggest price changes
Over the year to September 2026, the median price per sq ft rose most in The Valley (+38.6%) and International City (+33.5%), and fell most in Dubai Silicon Oasis (−24.9%). The table compares September 2026 with the same month a year earlier for areas with at least 30 sales in both months.
| # | Area | Change on a year |
|---|---|---|
| 1 | The Valley | +38.6% |
| 2 | International City | +33.5% |
| 3 | Dubai South | +21.0% |
| 4 | Al Furjan | +15.7% |
| 5 | Dubai Islands | +13.8% |
Off-plan share by area
Off-plan made up 100.0% of sales in Dubai Investments Park 1 over the six months to September 2026, the highest share of the areas we track, followed by Sobha One (99.5%). At the other end, The Views and The Lakes was 97.0% ready (title deed) sales.
| # | Area | Off-plan share, 6 months |
|---|---|---|
| 1 | Dubai Investments Park 1 | 100.0% |
| 2 | Sobha One | 99.5% |
| 3 | Sobha Hartland 2 | 99.2% |
| 4 | Dubailand (Wadi Al Safa 4) | 98.6% |
| 5 | Dubai Islands | 98.3% |
Most sold projects
Azizi Venice 14 recorded the most sales of any residential project in our DLD data over the past 24 months, with 2,363 transactions, followed by Binghatti Skyrise (2,272) and Sobha Orbis (1,838).
| # | Project | Area |
|---|---|---|
| 1 | Azizi Venice 14 | Dubai South |
| 2 | Binghatti Skyrise | Business Bay |
| 3 | Sobha Orbis | Motor City |
| 4 | Sobha Solis | Motor City |
| 5 | Skyvue | Sobha Hartland 2 |
Source: Dubai Land Department, via Yazdan Properties' DLD data feed. CC BY 4.0.
Want a tailored read for your own position?
30 minutes with our advisory team: we read the DLD numbers for your goal, whether you are buying, selling or investing, and tell you plainly what they mean.
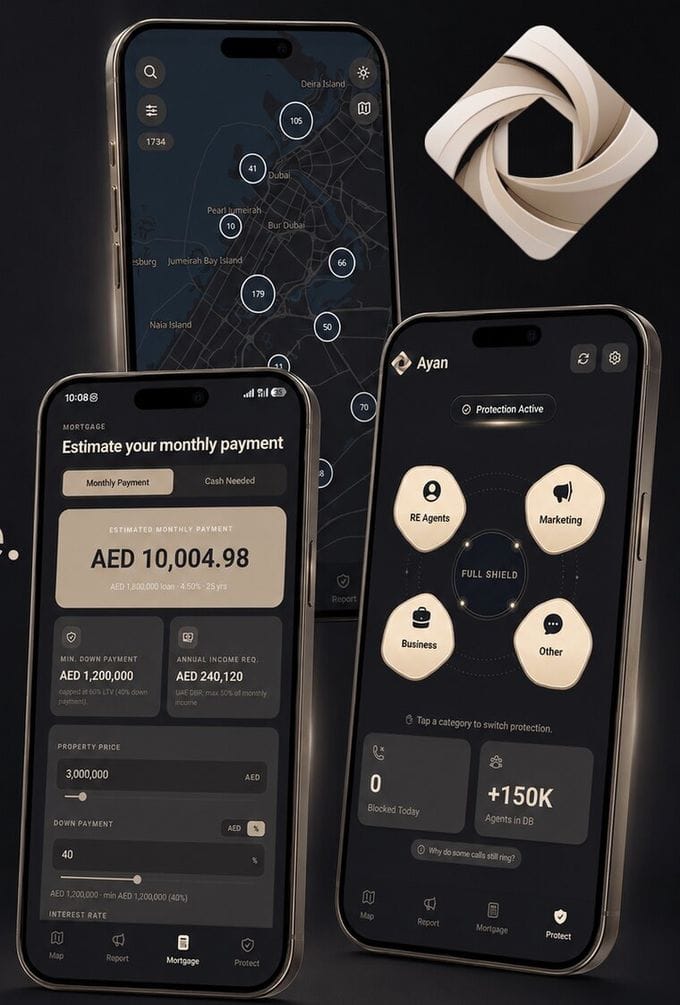
A live off-plan map of 1,700+ UAE projects, a full UAE mortgage calculator and OS-level spam-call protection, all in one app.
Get the AYAN app →Or go straight to the App Store or Google Play. On a computer? Open map.YAZDAN in your browser, no download needed.