Updated 3 October 2026 · Source: Dubai Land Department records · All Dubai area guides
These guides cover 58 Dubai communities, each built from Dubai Land Department sales and Ejari rent records. Pick an area for prices and rents by bedroom, rental yield, and what's selling.
Dubai areas at a glance, September 2026
| Area | Price per sq ft | Gross yield | Price change, 1 year |
|---|---|---|---|
| Al Barsha South (Al Barsha South Second) | AED 1,733 | 8.2% | down 2.9% |
| Al Furjan | AED 1,661 | 3.5% | up 16.2% |
| Al Jaddaf | AED 1,915 | 5% | down 4.9% |
| Al Kifaf (near Zabeel Park) | AED 2,219 | 4.7% | down 1.7% |
| Al Quoz 4 (Al Khail Heights) | AED 966 | 11.5% | |
| Al Satwa | AED 2,203 | 5% | up 4.1% |
| Al Yufrah 2 | |||
| Al Yufrah 3 | |||
| Arabian Ranches | AED 1,323 | 4.3% | down 11% |
| Arjan (Al Barsha South Third) | AED 1,529 | 6.4% | up 6.8% |
| Barsha Heights (TECOM) | AED 1,391 | 5.8% | down 39.5% |
| Business Bay | AED 2,149 | 3.6% | down 20.1% |
| City Walk (Al Wasl) | AED 3,062 | 4.8% | down 2.4% |
| DAMAC Hills 2 | AED 1,022 | 5.9% | down 0.2% |
| DAMAC Hills | AED 1,701 | 5.6% | up 8.8% |
| DAMAC Islands and DAMAC Sun City (Al Yelayiss 1) | AED 1,734 | 5.1% | up 2.8% |
| DAMAC Lagoons and Remraam (Al Hebiah Fifth) | AED 1,637 | 9.7% | down 0.5% |
| DAMAC Riverside, Dubai Investments Park 2 | AED 1,437 | down 3.6% | |
| Downtown Dubai | AED 2,861 | 4.4% | up 0.5% |
| Dubai Creek Harbour | AED 2,560 | 5.4% | down 0.1% |
| Dubai Hills Estate | AED 2,384 | 5.5% | up 5.9% |
| Dubai Industrial City (Saih Shuaib 2) | AED 1,483 | 3.2% | up 0.1% |
| Dubai Investments Park 1 | AED 1,033 | 4.2% | up 27.7% |
| Dubai Islands | AED 2,609 | 5.7% | up 11.4% |
| Dubai Marina | AED 2,128 | 4.6% | down 8.7% |
| Dubai Maritime City | AED 3,200 | 3.6% | up 4.8% |
| Dubai Production City (IMPZ) | AED 1,510 | 5.7% | up 3.4% |
| Dubai Silicon Oasis | AED 1,101 | 5.7% | down 26% |
| Dubai South | AED 1,659 | 9.2% | up 21% |
| Dubai Sports City | AED 1,258 | 5.6% | up 1.8% |
| Dubai Studio City (Al Hebiah Second) | AED 1,596 | 10.5% | up 5.6% |
| Dubailand (Wadi Al Safa 2) | AED 1,379 | 5.6% | up 4.7% |
| Dubailand (Wadi Al Safa 3) | AED 1,416 | 10.1% | down 4.5% |
| Dubailand (Wadi Al Safa 4) | AED 1,736 | 7.6% | down 11.7% |
| Dubailand (Wadi Al Safa 5) | AED 1,390 | 6.2% | down 3.7% |
| International City | AED 900 | 7.3% | up 33.5% |
| Jebel Ali Industrial (Jabal Ali Industrial Second) | AED 1,737 | 5.6% | up 20.8% |
| Jumeirah Lake Towers (JLT) | AED 2,016 | 4.8% | up 10.8% |
| Jumeirah Village Circle (JVC) | AED 1,426 | 6.7% | down 8.2% |
| Jumeirah Village Triangle (JVT) | AED 1,576 | 6.3% | up 0.4% |
| La Mer (Jumeirah First) | AED 2,928 | 5% | down 2.4% |
| Madinat Jumeirah Living (Umm Suqeim 3) | AED 2,672 | 5.2% | down 0.8% |
| Mirdif | AED 919 | 4.6% | down 31.9% |
| Motor City (Al Hebiah First) | AED 1,843 | 7.8% | down 2.7% |
| Mudon | AED 1,647 | 5.3% | up 7.9% |
| Nad Al Sheba | AED 2,533 | 4.2% | up 13.1% |
| Palm Jumeirah | AED 2,960 | 3.1% | down 13.3% |
| Rukan and The Acres (Wadi Al Safa 7) | AED 1,328 | 9.7% | up 8% |
| Saih Shuaib 1 | AED 2,365 | ||
| Sobha Hartland 2 (Bukadra) | AED 2,454 | 4.7% | down 0.6% |
| Sobha Hartland and Meydan (Al Merkadh) | AED 1,973 | 4.9% | down 5.5% |
| Sobha One (Ras Al Khor) | AED 2,460 | 6.3% | up 5.9% |
| The Springs and Emirates Hills (Al Thanayah Fourth) | AED 1,783 | 4.3% | up 14.8% |
| The Valley | AED 1,930 | 3.3% | up 37.1% |
| The Views and The Lakes (Al Thanyah Third) | AED 1,792 | 5.5% | down 3.9% |
| Town Square | AED 1,403 | 5.7% | down 6.1% |
| Warsan 4 | AED 1,195 | 6.4% | up 10.4% |
| Zabeel and Dubai Design District (Zaabeel Second) | AED 3,124 | 3.9% | up 5.7% |
Source: DLD-recorded sales and Ejari contracts, September 2026 reports.
Area comparisons
- Dubai Creek Harbour vs Downtown Dubai
- Town Square vs Al Furjan
- Dubai Marina vs Jumeirah Lake Towers
- Downtown Dubai vs Business Bay
- Jumeirah Village Circle vs Dubai Sports City
- Jumeirah Village Circle vs Dubai Silicon Oasis
- Dubai Hills Estate vs Arabian Ranches
- DAMAC Hills vs DAMAC Hills 2
- Palm Jumeirah vs Dubai Marina
- Business Bay vs Al Jaddaf
- Dubai South vs Al Furjan
- International City vs Dubai Silicon Oasis
- Dubai Islands vs Dubai Maritime City
- Mudon vs Town Square
- Dubai Production City vs Dubai Sports City
- The Valley vs Arabian Ranches
- Barsha Heights vs Jumeirah Lake Towers
- Dubai Creek Harbour vs Dubai Hills Estate
Market reports
For the wider picture, read our monthly reports built from the same DLD records.
- Dubai market report, August 2026: Prices firm as volume slips in August. A pause, or a turn?
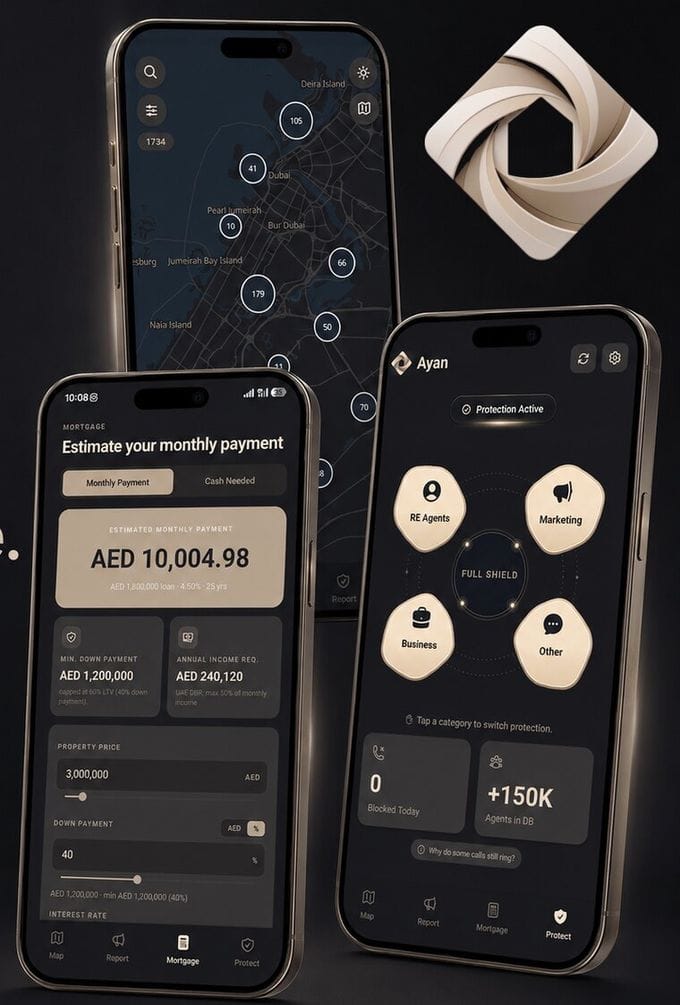
A live off-plan map of 1,700+ UAE projects, a full UAE mortgage calculator and OS-level spam-call protection, all in one app.
Get the AYAN app →Or go straight to the App Store or Google Play. On a computer? Open map.YAZDAN in your browser, no download needed.
YAZDAN Properties reads the DLD records against your plan to buy, sell or invest, and tells you plainly what they mean for you.
Book a 30-minute advisory call →Or email info@yazdan.ae directly.