Updated 3 October 2026 · Source: Dubai Land Department records · All Dubai area guides
Al Kifaf at a glance
The median home in Al Kifaf sold for AED 2,950,000 in September 2026, or AED 2,219 per sq ft. Price per sq ft is down 1.7% on a year earlier. Landlords are earning a gross yield of about 4.7%. Off-plan deals made up 63.3% of the month's sales.
Al Kifaf is an official Dubai Land Department district. Projects here include Avenue Park Towers, Park Gate Residences, Park Views Residences B.
Source: DLD-recorded transactions and Ejari contracts, September 2026 report. DLD district: Al Kifaf.
Al Kifaf prices and rents by bedroom
| Type | Median price | Sales | Median annual rent | Contracts |
|---|---|---|---|---|
| 1-Bedroom | AED 1,843,277 | 46 | AED 105,000 | 416 |
| 2-Bedroom | AED 2,693,277 | 134 | AED 150,000 | 613 |
| 3-Bedroom | AED 4,055,777 | 69 | AED 222,500 | 54 |
Sources: DLD-recorded sales (12 months) and Ejari rent contracts (24 months), to 3 October 2026. DLD district: Al Kifaf.
Rows with fewer than 30 records are left out.
How much more does an extra bedroom cost in Al Kifaf?
At the median, moving up from a 1-bedroom to a 2-bedroom adds about AED 850K; and from a 2-bedroom to a 3-bedroom adds about AED 1.36M. Use the gap to judge whether a bigger unit is worth the stretch, or whether a better building in the smaller size gives you more for the money.
Al Kifaf price per sq ft, quarter by quarter
From Q4 2024 to Q3 2026, the median price per square foot in Al Kifaf went from AED 2,060 to AED 2,201, up 6.8%. The table lists every quarter with at least 10 recorded sales.
| Quarter | Median AED per sq ft |
|---|---|
| Q3 2026 | AED 2,201 |
| Q2 2026 | AED 2,179 |
| Q1 2026 | AED 2,101 |
| Q4 2025 | AED 2,230 |
| Q3 2025 | AED 2,226 |
| Q2 2025 | AED 2,231 |
| Q1 2025 | AED 2,028 |
| Q4 2024 | AED 2,060 |
Source: DLD-recorded sales, quarters with at least 10 sales. DLD district: Al Kifaf.
Busiest projects in Al Kifaf, September 2026
| Project | Sales | Median price |
|---|---|---|
| Avenue Park Towers | 9 | AED 2,767,777 |
| Park Gate Residences | 5 | AED 3,025,000 |
| Park Views Residences B | 5 | AED 3,267,777 |
| 1 Residences | 4 | AED 4,125,001 |
| Park Views Residences A | 4 | AED 2,523,777 |
Source: DLD-recorded sales, projects with 3 or more sales in the month.
The most active developers here over the past 24 months were Park 1 (949 sales, 100%).
Source: DLD-recorded sales, 24 months to the end of September 2026.
Market reports
For the wider picture, read our monthly reports built from the same DLD records.
- Dubai market report, August 2026: Prices firm as volume slips in August. A pause, or a turn?
Questions buyers and owners ask
What is the rental yield in Al Kifaf?
The gross yield in Al Kifaf was 4.7% in the September 2026 DLD data. Net yield will be lower once service charges and vacancy are counted.
What is the price per square foot in Al Kifaf?
The median was AED 2,219 per sq ft in September 2026, down 1.7% on the same month last year.
Is Al Kifaf mostly off-plan or ready property?
Off-plan made up 63.3% of DLD-recorded sales in September 2026. The rest were ready homes changing hands.
Keep exploring
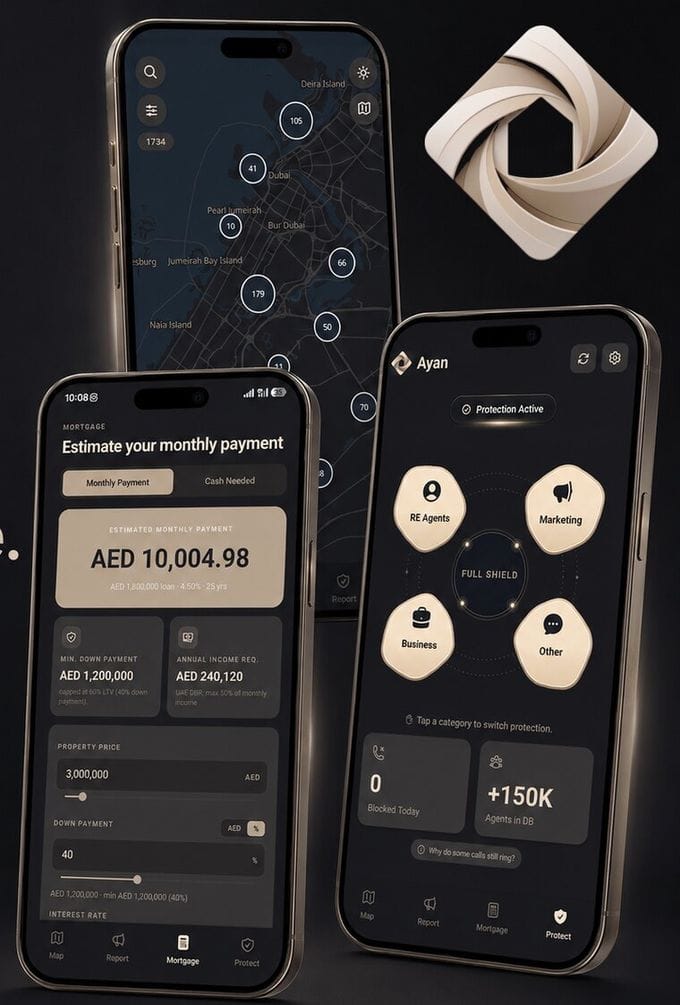
A live off-plan map of 1,700+ UAE projects, a full UAE mortgage calculator and OS-level spam-call protection, all in one app.
Get the AYAN app →Or go straight to the App Store or Google Play. On a computer? Open map.YAZDAN in your browser, no download needed.
YAZDAN Properties reads the DLD records against your plan to buy, sell or invest, and tells you plainly what they mean for you.
Book a 30-minute advisory call →Or email info@yazdan.ae directly.