Dubai property rankings · September 2026 · Dubai Land Department data, updated monthly
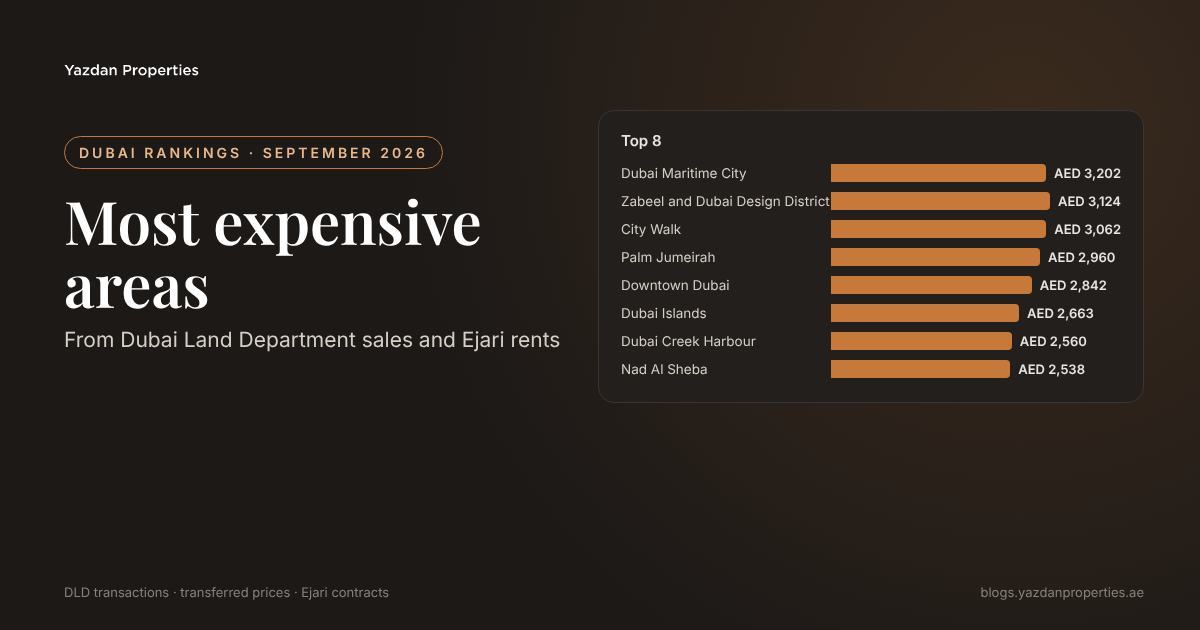
Dubai Maritime City was Dubai's most expensive area in September 2026, at a median of AED 3,202 per sq ft, ahead of Zabeel and Dubai Design District (AED 3,124) and City Walk (AED 3,062).
| # | Area | Median per sq ft | Median price | Change on a year | Sales |
|---|---|---|---|---|---|
| 1 | Dubai Maritime City | AED 3,202 | AED 2,489,120 | +4.9% | 116 |
| 2 | Zabeel and Dubai Design District | AED 3,124 | AED 4,000,000 | +5.7% | 31 |
| 3 | City Walk | AED 3,062 | AED 2,828,000 | −2.4% | 65 |
| 4 | Palm Jumeirah | AED 2,960 | AED 6,200,000 | −13.3% | 72 |
| 5 | Downtown Dubai | AED 2,842 | AED 3,110,000 | −0.2% | 172 |
| 6 | Dubai Islands | AED 2,663 | AED 2,709,500 | +13.8% | 150 |
| 7 | Dubai Creek Harbour | AED 2,560 | AED 2,322,490 | −0.1% | 391 |
| 8 | Nad Al Sheba | AED 2,538 | AED 2,505,300 | +13.3% | 100 |
| 9 | Sobha Hartland 2 | AED 2,454 | AED 2,005,108 | −0.6% | 130 |
| 10 | Sobha One | AED 2,432 | AED 1,990,156 | 36 | |
| 11 | Dubai Hills | AED 2,384 | AED 2,450,000 | +5.9% | 171 |
| 12 | Al Kifaf | AED 2,219 | AED 2,950,000 | −1.7% | 30 |
| 13 | Al Satwa | AED 2,204 | AED 1,618,700 | +4.2% | 50 |
| 14 | Dubai Marina | AED 2,128 | AED 2,454,774 | −8.7% | 232 |
| 15 | Business Bay | AED 2,115 | AED 2,000,000 | −21.4% | 437 |
| 16 | Jumeirah Lake Towers | AED 2,037 | AED 2,088,000 | +12.0% | 239 |
| 17 | Sobha Hartland and Meydan | AED 1,973 | AED 1,499,478 | −5.5% | 212 |
| 18 | The Valley | AED 1,952 | AED 4,170,870 | +38.6% | 365 |
| 19 | Al Jaddaf | AED 1,914 | AED 1,451,999 | −5.0% | 185 |
| 20 | Motor City | AED 1,843 | AED 1,050,000 | −2.7% | 407 |
| 21 | The Views and The Lakes | AED 1,753 | AED 2,100,000 | −6.0% | 32 |
| 22 | Al Barsha South | AED 1,746 | AED 876,500 | −2.2% | 84 |
| 23 | Dubailand (Wadi Al Safa 4) | AED 1,737 | AED 1,306,000 | −11.7% | 357 |
| 24 | DAMAC Islands and DAMAC Sun City | AED 1,734 | AED 3,238,690 | +2.8% | 113 |
| 25 | DAMAC Hills | AED 1,729 | AED 1,246,500 | +10.6% | 144 |
| 26 | Dubai South | AED 1,659 | AED 784,000 | +21.0% | 900 |
| 27 | Al Furjan | AED 1,653 | AED 1,829,375 | +15.7% | 537 |
| 28 | Mudon | AED 1,641 | AED 3,625,000 | +7.5% | 58 |
| 29 | DAMAC Lagoons | AED 1,638 | AED 1,393,200 | −0.4% | 410 |
| 30 | Dubai Studio City | AED 1,599 | AED 568,000 | +5.8% | 91 |
| 31 | Jumeirah Village Triangle | AED 1,571 | AED 1,136,156 | +0.1% | 148 |
| 32 | Arjan | AED 1,527 | AED 949,000 | +6.6% | 221 |
| 33 | Dubai Production City | AED 1,510 | AED 940,000 | +3.4% | 235 |
| 34 | DAMAC Riverside, Dubai Investments Park 2 | AED 1,437 | AED 2,010,000 | −3.6% | 55 |
| 35 | JVC | AED 1,423 | AED 967,238 | −8.4% | 813 |
| 36 | Dubailand (Wadi Al Safa 3) | AED 1,416 | AED 721,999 | −4.5% | 655 |
| 37 | Town Square | AED 1,403 | AED 1,457,500 | −6.1% | 110 |
| 38 | Dubailand (Wadi Al Safa 2) | AED 1,379 | AED 977,388 | +4.7% | 96 |
| 39 | Dubailand (Wadi Al Safa 5) | AED 1,375 | AED 1,100,000 | −4.8% | 467 |
| 40 | Rukan and The Acres | AED 1,328 | AED 1,553,938 | +8.0% | 55 |
| 41 | Dubai Sports City | AED 1,256 | AED 997,680 | +1.6% | 214 |
| 42 | Warsan 4 | AED 1,194 | AED 750,500 | +10.4% | 118 |
| 43 | Dubai Silicon Oasis | AED 1,117 | AED 1,035,000 | −24.9% | 107 |
| 44 | Dubai Investments Park 1 | AED 1,036 | AED 968,010 | 348 | |
| 45 | DAMAC Hills 2 | AED 1,022 | AED 1,580,000 | −0.2% | 106 |
| 46 | International City | AED 900 | AED 542,888 | +33.5% | 185 |
Median DLD transferred price per sq ft, all property types, areas with at least 30 sales in the month. Each area name links to its full September 2026 market report.
How we build this ranking
Every figure comes from Dubai Land Department transactions and Ejari rent contracts, pulled through Yazdan's own DLD data feed. We use transferred prices, not asking prices, and we leave out areas with too few records to give a reliable median. The ranking is rebuilt each month when DLD publishes the full month.
More Dubai rankings
- Highest rental yields
- Cheapest areas to buy
- Cheapest areas to rent
- Biggest price changes
- Off-plan share by area
- Most sold projects
- All rankings
- Area market reports
- Service charges by building
Deciding where to buy?
Tell us your budget and whether you want yield or growth. We'll shortlist areas and buildings using the same DLD sales and rent records.
Book a 30-minute advisory call →Prefer WhatsApp? Chat with us on WhatsApp
Source: Dubai Land Department sales and Ejari rent contracts, September 2026, via Yazdan Properties' DLD data feed. Data shared under CC BY 4.0. Yazdan Properties is a RERA-registered brokerage. General information, not financial advice.
A live off-plan map of 1,700+ UAE projects, a full UAE mortgage calculator and OS-level spam-call protection, all in one app.
Get the AYAN app →Or go straight to the App Store or Google Play. On a computer? Open map.YAZDAN in your browser, no download needed.